Lesson 1 · from Chapter 1
Two Structures, One Building
On the wall near the reception desk, the organization looks simple. Boxes, names, lines running neatly downward. It is a useful document and an incomplete one — and the difference between those two words is most of what this book is about.
Step one
Five ideas
Read each one. Mark it read, or have it read to you. The test at the bottom draws from these five and nowhere else.
Idea one
Useful, and not complete
An org chart tells you who is formally employed, where their role sits, and who is expected to manage whom. It answers basic questions quickly. Who approves annual leave? Which team owns payroll? A new employee on their first day gets a starting point.
Its value should not be dismissed. Organizations need a visible account of formal responsibility. Without one, new people do not know who to approach, managers cannot be held accountable for teams they are not clearly assigned to lead, and important obligations — legal compliance, financial control, safeguarding, safety — can disappear into ambiguity.
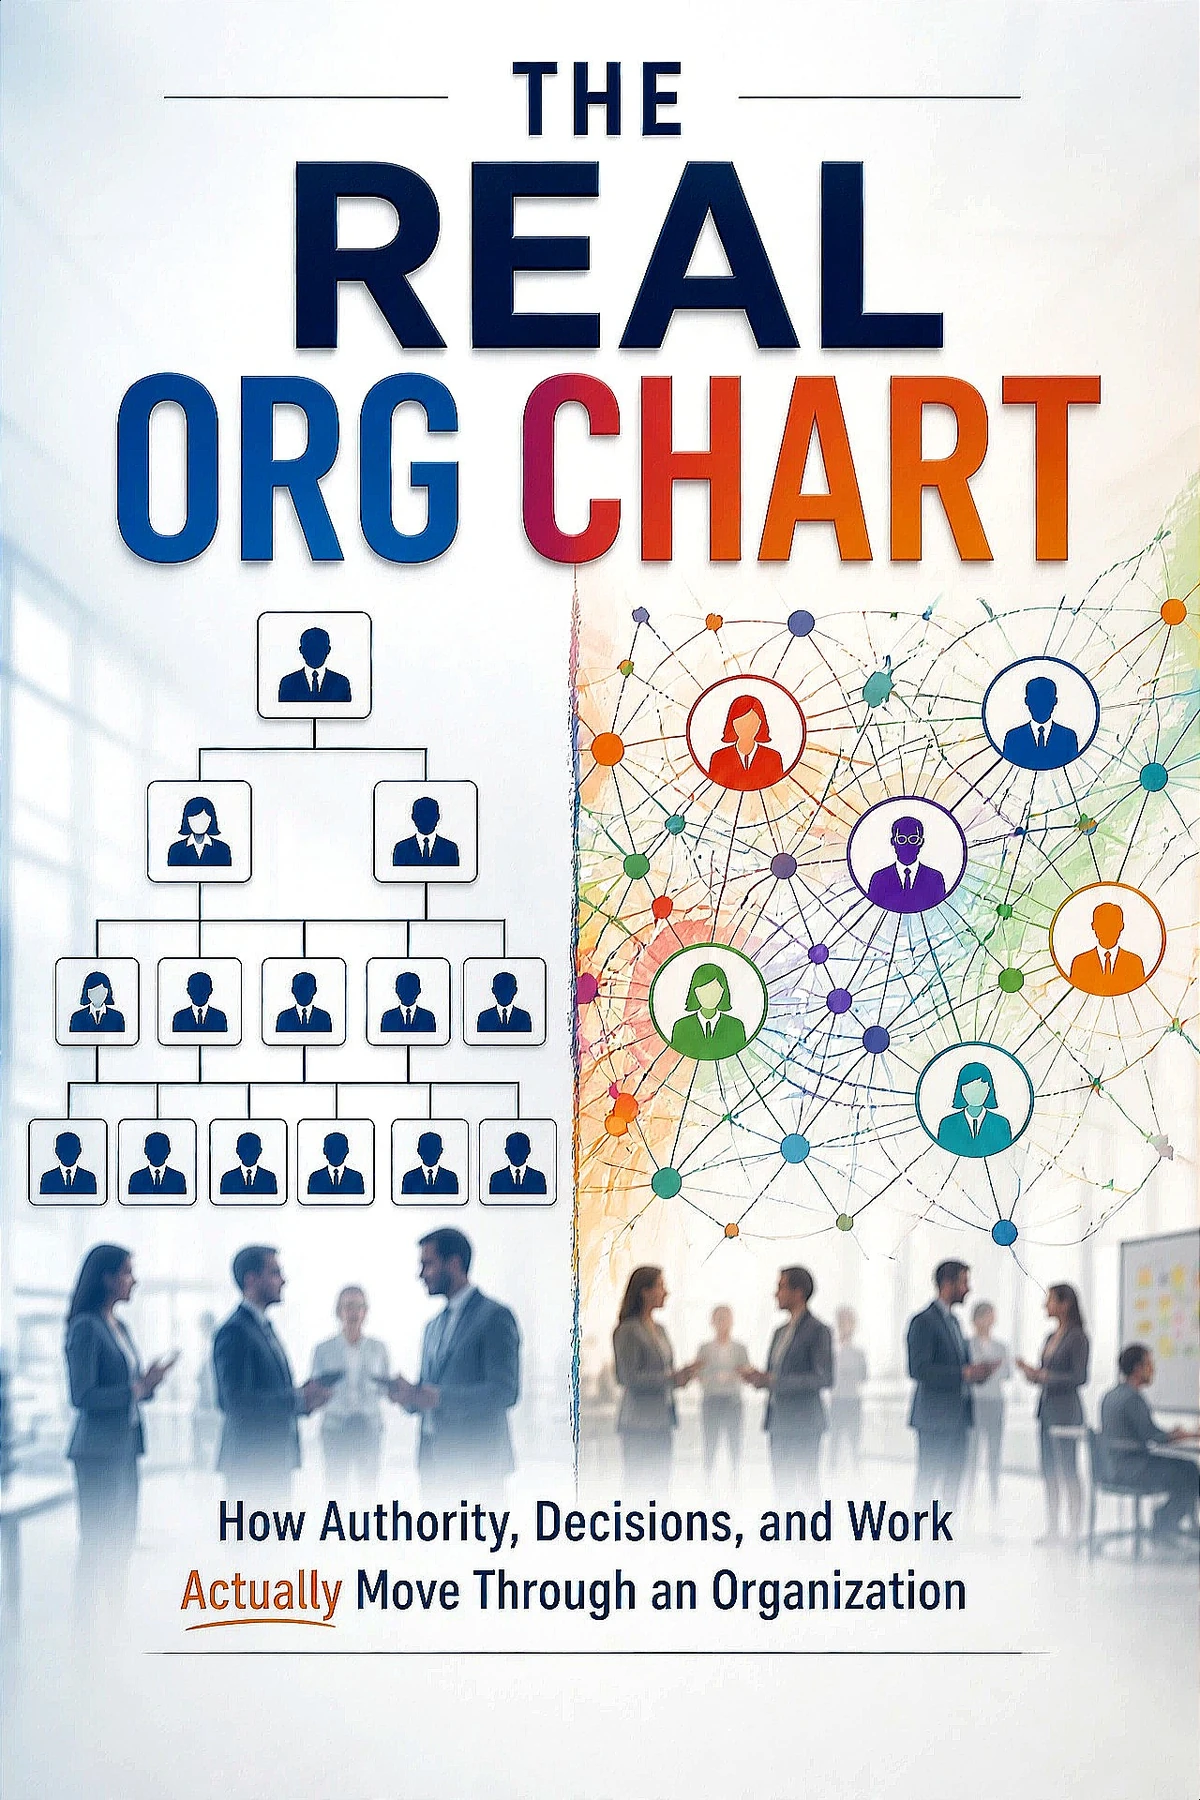
But the published chart is not a map of how work gets done. It is a map of how the organization has chosen to describe itself.
And that is not dishonesty. A chart is designed to simplify. It cannot show every conversation, exception, judgment call, workaround, historical relationship or unofficial gatekeeper. If it did, it would cease to be readable. A proper org chart is necessarily selective.
The problem begins when people mistake selective for complete.
A new manager often makes exactly that mistake in their first week. They study the titles, memorize the departments, and assume they now understand the organization. Then they try to get something done and discover the chart did not mention the person everyone consults before a significant decision. It did not show the long-serving coordinator who knows which requests will be rejected, or the executive assistant whose judgment determines whether a proposal reaches the chief executive this week, next month, or not at all.
Idea two
Reporting lines and dependency lines
Here is Northstar Services, a growing business that installs and maintains energy equipment for commercial buildings. The chart says Maya, Head of Operations, is responsible for the field service teams. Daniel, Head of Sales, leads account executives. Priya, Finance Director, owns billing and credit control. All of this is true. It is not enough.
A customer calls on a Tuesday morning. Their equipment has failed at a site that cannot afford to close. The account executive hears it first, because the customer trusts him. He messages a service manager directly, bypassing customer support. The service manager calls a field engineer, who says a replacement part is needed. The part is in stock — but the warehouse will not release it until someone confirms the account is not on hold. Finance has placed the account on hold because an invoice has been overdue for sixty-two days.
At this point the formal chart offers only fragments. It can tell you the service manager reports to Maya and the finance manager reports to Priya. It cannot tell you whether the service manager is allowed to override the account hold in an emergency. It cannot show that the account executive has worked with the finance manager for years and knows a phone call gets a faster answer than the ticketing system. It cannot tell you that nobody has decided who takes responsibility when customer retention, debt collection and operational safety point in different directions.
The chart shows reporting lines. The work follows dependency lines.
This is the first distinction to keep in mind throughout the book. A reporting line tells you who has formal managerial authority over a person. A dependency line tells you whose action, agreement, information or permission is needed before work can continue.
A salesperson may depend on a legal adviser to approve contract language. A warehouse supervisor may depend on procurement to reorder a critical component. A team leader may depend on an IT administrator to grant access to a system. None of these relationships necessarily appear on an org chart, yet they determine whether the business can move. Organizations are full of dependency lines. Most are not shown anywhere.
Idea three
Titles and influence are not the same thing
The chart does not show that one director has an impressive title and little influence, while another has no direct reports and seems to be included in every important conversation. Titles and influence are related, but they are not the same thing.
Formal authority matters most when an organization needs clarity, accountability and a final decision. A manager sets priorities. A budget holder approves spending within their limits. A board appoints a chief executive. These powers are real, and it is dangerous to pretend otherwise.
Yet informal influence often determines what reaches the formal decision-maker, how a problem is framed, which option is treated as realistic, and whether a decision is actually carried out. The person with authority may sign the document. The person with influence may have shaped everything that made the signature likely.
Which is why people say "You need to speak to Sam" even when Sam is not listed as the owner of the issue. They may mean Sam has expertise. They may mean Sam is trusted by the person with formal authority. They may mean Sam has seen this before and knows the hidden constraint.
That sentence is a clue. Pay attention to it. So are the others you hear every week: "That has to go through her." "He will want to see it before it moves." "Don't send that to the shared inbox — call Louise." "They are technically responsible, but Aaron is the one who knows how it works." "We need Finance's sign-off, but speak to the commercial team first."
Each phrase describes the real organization more accurately than a line on a chart.
Idea four
Structure, but not flow
The published chart also omits time. It may show that an IT security team sits within Technology and supports the rest of the company. It does not show that a routine access request takes two days, a new supplier review takes three weeks, and an exception involving customer data requires a meeting that happens once a month. It does not show the queues, the approval thresholds, the overloaded specialists, or the seasonal pressures that make one department responsive in January and unreachable in September.
In other words, the chart identifies structure but not flow.
And that omission has a practical consequence, which is where most management error starts. Leaders who see a problem only through the chart often diagnose it as a people problem. Sales is frustrated with Operations, so perhaps the operations manager needs to be more collaborative. Product is delayed by Technology, so perhaps the technology lead needs to be more accountable. Finance is perceived as obstructive, so perhaps Finance needs to become more commercial.
Sometimes those conclusions are fair. Often they are too shallow.
The apparent conflict may be created by a decision path nobody has designed. Operations may be waiting for incomplete information from Sales. Technology may be protecting the business from risks no one else has agreed to own. Finance may be enforcing a policy because it is the only team measured on overdue debt. People can look unhelpful when they are responding rationally to the pressures, rules and incentives built around them.
The chart rarely shows those pressures. It shows who occupies the boxes while concealing the conditions under which they operate.
Idea five
The network
A good manager learns to read the chart for what it is. It is not a false document. It is a partial document. It provides the formal skeleton — roles, departments, management accountability, intended hierarchy. That skeleton is important. But no organization lives through its skeleton alone.
The living organization is made of conversations, trust, habits, bottlenecks, personal credibility, unofficial routines, and decisions about whose judgment counts. It is made of the paths people use when the standard route is too slow, too unclear, or known to fail.
The chart tells you where people are supposed to sit. The network tells you where work actually goes.
And be careful how you hear that. The network is not a conspiracy, and it is not necessarily a sign of poor management. It is what forms whenever people have to solve problems together. Formal structure assigns roles. Real work creates connections. Over time those connections become routes: reliable ways to obtain information, secure a decision, interpret a rule, find a resource, or stop a problem getting worse.
Some networks are built deliberately — a weekly operations meeting, a shared system, a named escalation route. Others grow through experience. People learn who replies quickly, who gives a clear answer, who can explain a complicated policy without making them feel foolish. They develop shortcuts not because they dislike process, but because they are trying to keep work moving. This is why the person everyone calls is often not the person with the most senior title.
Back at Northstar, the formal route for an urgent account hold is clear: submit to a shared Finance mailbox with the account number, the overdue value, the value of the proposed work, the reason for the exception and commercial approval. Finance reviews within one business day. That route may be suitable for most cases. It is not suitable for a customer whose failed equipment is stopping a site from operating today.
So the account executive calls the finance manager directly. She checks, discovers part of the overdue balance relates to an invoice the customer has challenged, and agrees to release the part if Daniel confirms Northstar will pursue the debt separately. The engineer leaves for the site. From the customer's view, Northstar acted responsibly and quickly. From the perspective of the real organization, a known network has activated around an exception.
Step two
The Tuesday morning part
Northstar's customer is down and needs a part. This bench counts the dependency gates that job has to clear, shows how many of them the published chart can account for, and asks whether the formal route can finish in time.
Try this. Take the charted share from nothing to everything and watch the gate count and the elapsed time. Neither moves. Drawing more of the organization on the wall does not change how the work travels — the chart is a description, not a mechanism. That is the single most useful thing on this page.
Then pick a real job at your own work that crosses three or more departments, and list every point where it stops until somebody else acts, agrees, informs or permits. Count them. Then look at your chart and see how many of them are on it.
Step three
Show that it holds
Ten situations, two per idea, drawn at random. Two right in a row on an idea marks it solid. A wrong answer tells you why that particular choice fails, and sends you back to the one idea it was testing.
All five hold.
You can say what a chart is for and where it stops, tell a reporting line from a dependency line, hear the sentences that reveal real influence, spot a flow problem being misdiagnosed as a people problem, and describe the network without treating it as misconduct. Lesson two follows a decision all the way from the moment somebody notices something is wrong.
The Real Org Chart
This lesson teaches chapter 1. The book runs to fourteen chapters, worked end to end through a single company — how a decision travels, where authority and responsibility come apart, what a handover really costs, and how to draw the structure your organization actually uses. Written and donated to the Foundation by GSU's founder, Dr. Gene A Constant.
Read on Kindle The whole class
The class is free and always will be. As an Amazon Associate, Global Sovereign University earns from qualifying purchases; every cent funds tuition-free education.
Global Sovereign University: Different by Design. Better by Mission.