Lesson 12 · from Chapter 13
Measuring CCM
An organisation can define identities, enforce permissions, build red-tolerance gates and protect attention — and still manage the whole thing with measurements inherited from a less complex era. This lesson is about the numbers worth a dashboard, and the far larger set that only look like measurement.
Step one
Five ideas
Read each one. Mark it read, or have it read to you. The test at the bottom draws from these five and nowhere else.
Idea one
Conventional measures capture visible production
Leaders introduce agents and then ask familiar questions. How many tasks completed? How much time saved? How many cases closed? What is the cost per transaction? These measures are not wrong. Throughput, cost, speed and service levels remain important — a hybrid system that consumes more resources, delays customers and creates no meaningful output is not made successful by calling itself intelligent.
The problem is that conventional measures capture only one dimension of performance: visible production.
They do not reveal whether the system is producing trustworthy work, whether its knowledge remains grounded, whether it is silently transferring work to human reviewers, whether its apparent efficiency depends on exhausting specialists, or whether it is accumulating the maintenance debt that later surfaces as drift, security exposure, compliance failure or systemic loss of trust.
So in CCM, performance must be understood as sustained capability. A system is capable not merely when it can act, but when it can act reliably within its authority, preserve the evidence behind its actions, recover when conditions change, and leave human operators with enough cognitive capacity to supervise, challenge and improve it.
Which changes the question. It is no longer how much work did the AI complete? It is: did the hybrid system create legitimate value without degrading its epistemic integrity, operational resilience, or human judgement?
Idea two
No metric should be interpreted in isolation
Traditional indicators are mostly lagging — they tell you what already happened, and usually after it became expensive. By the time complaints rise, an agent may have produced hundreds of flawed communications. By the time rework is visible, an obsolete source may have contaminated a retrieval pipeline for weeks. By the time burnout shows in a survey, automation bias may already be normalised.
So CCM needs leading indicators too. A leading indicator does not predict the future with certainty; it gives an early signal that the conditions required for safe performance are weakening. Rising validator disagreement may mean a policy source became ambiguous, a retrieval relationship drifted, or a model update changed the system's reasoning. More repeated tool calls may reveal an invisible queue or an agent stuck in a retry loop. A sudden fall in human overrides may mean better quality — or fatigue, interface pressure, growing automation bias. The number has no meaning without context.
This is the first discipline of measurement in the agentic enterprise: no metric should be interpreted in isolation.
Take a dashboard celebrating a twenty percent rise in cases completed per hour. Customers get faster responses, the queue is smaller, cost per case fell. A CCM dashboard asks what else moved. Did post-completion corrections change? Are specialists receiving better-prepared escalations, or reconstructing reasoning from fragments? Did autonomous completion rise because the system is better grounded — or because the autonomy threshold has been quietly relaxed? Are customer escalations falling, or merely delayed? Are specialists resolving exceptions after hours that never appeared in the completion metric?
Because the arithmetic is unforgiving. A system that closes cases quickly but generates more reopened cases is not efficient. A system that reduces human handling time while increasing cognitive strain is not fully productive. A system that produces fewer visible exceptions because employees are too exhausted to challenge it is not reliable — it is simply concealing risk behind a favourable dashboard.
Idea three
Five things worth measuring, not one
Productive flow — completion time, queue age, throughput, cost per resolved case, successful tool execution, service-level adherence. Necessary, because the workflow must create real operational value rather than demonstrate technical sophistication.
Quality of outcome, paired with it — rework, case reopening, downstream defect discovery, customer correction requests, failed executions, and how much completed work stays valid after independent review. In software: code churn, rollback frequency, production defects, the rate at which AI-generated changes need later correction.
Epistemic integrity — citation coverage, source freshness, retrieval relevance, source-conflict frequency, unsupported-claim rates, validator disagreement, and how much consequential output retains complete provenance from source to decision. And a warning attached: this must not become a superficial exercise in counting citations. An answer with ten irrelevant citations is not better grounded than an answer with two authoritative ones. The agent should not score well merely for attaching several policy documents — it should score on whether it identified the current policy, recognised the customer-specific amendment, separated binding contractual language from background guidance, and escalated when those could not be reconciled within its authority.
Control integrity — blocked unauthorised tool calls, permission-denial patterns, policy-as-code violations, credential issuance and revocation, unusual delegation, and how often agents are shifted from autonomous execution to recommendation-only.
Human cognitive sustainability — alert volume per operator, interruption frequency, time in exception queues, after-hours intervention, workspace switching, escalation quality, and the gap between agent-generated demand and available qualified oversight. These signals must never be used to rank, punish or surveil individuals. Their purpose is to identify design conditions that make safe work difficult.
And underneath all of it, adaptive health: regression performance, drift detection, evaluation coverage, time to detect abnormal behaviour, time to contain a risky agent, time to repair a degraded workflow, and recurrence of known failure modes. This is the maintenance dimension. It reveals whether the enterprise can restore capability when conditions change.
Idea four
Protective interruption, or avoidable friction
At first glance a high number of blocked actions looks like bad news. In some circumstances it is evidence that the control system is functioning as intended. A communication agent prevented from reaching protected contract content has not failed — it met a boundary that preserved enterprise security.
The meaningful question is what the block represents: an isolated abnormality, a poorly designed workflow, a changing business condition, or an attempt to exceed legitimate authority. Metrics must therefore distinguish between protective interruption and avoidable friction.
Red-tolerance gates make this concrete. A rising gate rate may indicate deterioration — a retrieval failure, expanding policy ambiguity. It may equally reflect healthy caution after the organisation introduces a new contract category, regulatory requirement or risk-sensitive offering.
Which produces a rule that matters more than any threshold. The organisation should not pressure teams to reduce gate volume indiscriminately. Doing so may encourage unsafe threshold changes and convert a visible control into a hidden failure.
That last phrase is the thing to carry. A gate you can see is doing its job even when it is inconvenient. Move the threshold to make the number look better and the condition does not go away — it simply stops being reported, and the first evidence of it will now arrive as a customer, compliance or security event instead.
Idea five
A dashboard is visual management, not a display
Maintained capability cannot be managed through a monthly report. By the time leadership learns that rework has risen or specialists are working after hours, the condition may already have spread across hundreds of cases. A system that can act in seconds can also drift, overload or propagate a defect in seconds, so its maintenance system must run close enough to real time for intervention to still be meaningful.
But the purpose is not to make every internal action visible to every manager — that reproduces the overload CCM exists to reduce. Nor is it a theatrical display of sophistication: glowing agent maps, streaming token counts, animated workflow diagrams that look impressive while obscuring what requires action.
A useful dashboard answers one disciplined question: what abnormality requires attention now, who is responsible for responding, and what legitimate action is available?
Which returns to the visual-management logic of TPM. On a well-run factory floor a signal does not display every movement of every machine; it makes deviation visible early enough to correct. Here the deviation may be epistemic rather than mechanical, behavioural rather than physical — and the principle is unchanged. The dashboard must distinguish normal variation from abnormal conditions.
So each role sees a different view of the same flow. The executive sees whether productivity gains are being sustained without rising quality, security or human-capacity risk. The process owner sees where queues and escalation patterns reveal workflow weakness. The AI Mechanic sees drift, retrieval degradation and evaluation failures. The security steward sees identity anomalies and containment status. The specialist sees only the evidence, the authority boundary and the next decision required to resolve the case.
No one needs every metric. Everyone needs the right visibility. And the central measure of success is not maximum autonomous activity — it is maintained cognitive capability.
Step two
Reading a gate rate
Ten gates is not a number you can interpret. Ten gates spread across unrelated complex cases and ten gates all from the same new contract template are opposite findings. Set the distribution, not just the volume.
Try this. Set the volume to ten and the concentration to zero, then read the verdict. Now leave the volume at ten and take concentration to a hundred. Same number of gates, opposite finding — and no monthly report that shows only the count could tell you which one you have.
Then try the state most organisations end up in: a high rate, well distributed, above review capacity. That is not a control problem. It is a staffing and design problem wearing a control problem's clothes.
Step three
Show that it holds
Ten situations, two per idea, drawn at random. Two right in a row on an idea marks it solid. A wrong answer tells you why that particular choice fails, and sends you back to the one idea it was testing.
All five hold.
You can say what conventional measures miss, refuse to read a metric alone, name the dimensions worth measuring, tell protective interruption from avoidable friction, and design a dashboard around the abnormality rather than the activity. Lesson thirteen turns to the boundary itself — who sets it, and what makes it enforceable rather than aspirational.
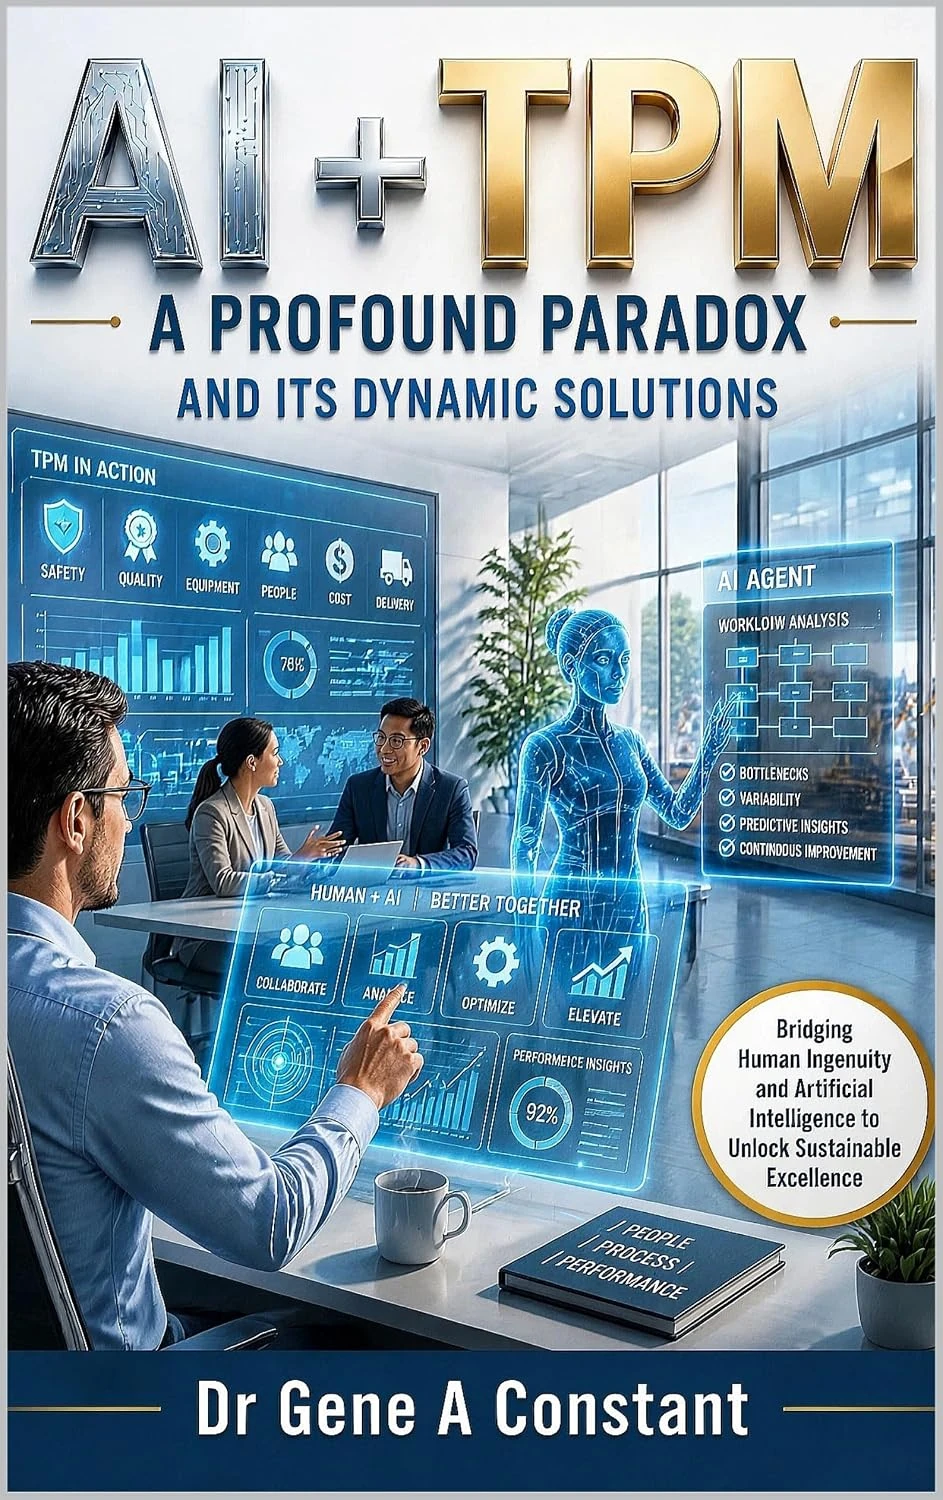
AI + TPM: A Profound Paradox and Its Dynamic Solutions
This lesson teaches chapter 13. The book runs to twenty chapters and sets out Cognitive Capability Maintenance in full — the framework this class is built on. Written and donated to the Foundation by GSU's founder, Dr. Gene A Constant.
Read on Kindle The whole class
The class is free and always will be. As an Amazon Associate, Global Sovereign University earns from qualifying purchases; every cent funds tuition-free education.
Global Sovereign University: Different by Design. Better by Mission.