Lesson 13 of 20 · Chapter 13
Focused Improvement and Data-Driven Kaizen
Some losses never go away. They get fixed, come back, get fixed again. This chapter is about ending that loop. A chronic loss crosses department lines, so the team that kills it has to cross them too. Data points the team at a narrow target, the team goes to the machine to see, and the fix is not finished until it holds without anyone watching it.
Choose how you want to learn
You can change this any time. Every level does the same hands-on steps. Press Listen on any part to hear it read aloud.
- 1 · The team
- 2 · The Kaizen cycle
- 3 · Split the data
- 4 · Leads, not blame
- 5 · Make it hold
- 6 · Try it at work
- 7 · Your card
- 8 · Check yourself
Part 1
The loss crosses boundaries, so the team must too
A chronic loss rarely belongs to one department. So the team to fix it includes the people the problem passes through.
The operator knows how each shift really does the work. Maintenance knows how things fail and whether repairs truly restore the machine. Quality protects what “good” means. Engineering turns a repeated symptom into a design change.
A sponsor does not solve the problem. Their job is to keep the team from being starved of time when production gets busy.
Formation starts with a precise problem statement, strong enough that the team cannot drift into opinion, and a team built around the path the problem takes rather than the org chart. Leave operators out and the countermeasures look perfect on paper and fail on Tuesday night. Leave maintenance out and the team misdiagnoses root cause and wonders why recurrence continues.
Quality is there to stop the classic trap where a countermeasure improves availability but creates defects, or improves speed but increases variation, quietly moving the loss into the quality bucket. The team leader runs the cycle and keeps evidence and actions aligned.
“Cross-functional teams exist for a simple reason: the loss travels across boundaries, so the solution must also travel across boundaries.”
“It is about making the problem definition precise enough that the team cannot drift into opinion.”
“The sponsor’s job is not to solve the problem; it is to keep the system from starving the team when production pressure rises.”
Read the whole chapter free in the book reader.
Five things said in a first team meeting. Which team member is each one most likely to bring?
Part 2
Data to target, the machine to see, data to verify
Data-driven Kaizen does not mean staring at dashboards hoping a pattern appears.
It means three moves. Use data to target a narrow problem. Go to the machine and see it happen. Come back to the data to prove the fix worked.
Every fix has two halves: a technical fix (a shield, a bracket, a setting) and a standard fix (the routine work changed so the cause cannot come back).
At the machine the team captures evidence (photos, short videos, timestamps, trend snapshots) and does root cause analysis in the language of conditions, not stories. The operator becomes central here, because they can recreate the normal work sequence and show where the system pulls people toward a workaround.
If the team changes a cleaning method, the mobile route must change too, with a verification gate. If it adds shielding, it adds an inspection point. If it changes thresholds, it applies change control. The countermeasure is not complete until normal is updated and distributed.
“It means the team uses data to target, then goes to the machine to see, then returns to data to verify.”
“Finally, the team designs countermeasures that include a technical fix and a standard fix.”
“In other words, the countermeasure is not complete until normal is updated and distributed.”
Seven steps of a focused improvement, shuffled. Put them in order.
Part 3
Averages are where root causes hide
First, translate: count thousands of small stops in the same units as big breakdowns, so “running” stops hiding lost time.
Then segment: split the losses by shift, product, and time since changeover. Daily totals make a line look randomly annoying. Split the right way, a pattern appears.
The figure below uses a real-looking week of stops. Try each split and watch where the rate jumps.
Segmentation can run by product family, shift, time since changeover, state transitions, ambient conditions and maintenance actions. The chapter’s example: micro-stops spike in the first forty minutes after changeover on product family B.
That turns “watch the line” into a narrow target: a specific forty-minute window, after a specific changeover, in a specific product mode. Pareto still helps, now in several dimensions at once, but every analysis must end in a decision and a closure path.
“Translate thousands of small events into one comparable picture of loss.”
“The second analytic move is segmentation, because averages are where root causes go to hide.”
“If the team segments by time since changeover, a pattern might appear: micro-stops spike in the first forty minutes after changeover on product family B.”
One week of stops on one line. Choose a split; every rate is stops divided by hours, calculated from the table. The data is an illustration.
Part 4
Correlation is a lead, history is a clue
If one shift has more stops, the first question is not “who is doing it wrong?” It is “what conditions differ?” Different products? Different changeover times? A standard that is hard to follow?
Correlation is not blame, and it is not proof. It is a lead to test at the machine.
Join the loss data to maintenance history: a motor replaced twice in six months and still failing is a clue that the repair is not restoring the real cause.
Big data is useful because it forces those questions into evidence rather than assumption. But it becomes toxic if leadership uses it to assign fault rather than to remove system causes: blame destroys truth, and without truth the plant cannot stabilise.
The chapter’s speed-loss example joins cycle time with current and temperature, and finds the loss starts when current variance widens at steady state. That sharpens the hunt: drag from build-up that is cleaned inconsistently? Alignment drifting because mounting surfaces are not restored? Every output must generate a work object.
“Modern TPM must be blunt: correlation is not blame, and correlation is not causation.”
“It is a lead.”
“A fourth move, where big data becomes genuinely powerful for loss reduction, is joining operational loss data to maintenance history and condition evidence.”
Three findings from the data. What is the right next move for each?
Part 5
Easy to start, hard to hold
Improvement is easy to start and hard to hold. Two weeks after a win, the old loss often creeps back.
So a fix is not done when it is installed. It is done when the loss stays down across shifts, products and states for a hold period (30, 60 or 90 days), and the new standard is followed under pressure.
Ask: if the best person on this line is off, will it still hold? If not, it is not sustained; it is being carried. And when it does hold, remove the old checks that only managed the old problem.
The countermeasure must show up at once in the changeover steps, the inspection standard and the parts standard, or the win exists only as memory, the least reliable control system in the plant. Each initiative stays a living work object through its hold period, with readable states.
Keep it alive with rhythms, not meetings: a short daily look at the line, a weekly cross-functional health review, and measures tied to recurrence and closure rather than the number of Kaizen events. If success never frees up capacity, people experience Kaizen as more work forever.
“Two weeks later, the same loss begins to creep back, and the organization learns the most painful lesson in Kaizen: improvement is easy to start and hard to hold.”
“The sustainment question should always be: “If the best person on this line is absent, will the standard still hold?” If the answer is no, the initiative is not sustained.”
“It is being carried.”
“If the plant never harvests capacity from success, people experience Kaizen as “more work forever,” and the culture slowly rejects it.”
The Kaizen Bench. Split the data, pick the target, design the fix, and decide what counts as holding.
Part 6
Try it where you work
Do these on a real machine: at work if you work with equipment, or at home on a car, washing machine, furnace or lawn mower if you do not. Tick each one when it is done. Safety first: look and clean only what you are allowed to touch, never reach into moving equipment, and follow your site’s lockout rules.
Part 7
Your “My Kaizen Sheet” card
One chronic loss, taken from target to holding. Nothing you type here leaves this device.
My Kaizen Sheet
Global Sovereign University · Modern TPM, lesson 13
Focused improvement
- Build the team around the path the loss takes.
- Data to target, machine to see, data to verify.
- Split until the target is narrow.
- Correlation is a lead, not blame.
- Technical fix plus standard fix.
- Hold it without the hero; harvest the capacity.
Easy to start, hard to hold. It seems better is an incomplete sentence.
Part 8
Check yourself
Six real situations. Pick what you would do. You will see why after each one.
Lesson 13 complete.
You can now form a team around a chronic loss, run the data-to-machine-to-data cycle, segment until the target is narrow, treat correlation as a lead, and hold a fix without a hero. Next: Lesson 14, quality maintenance through computer vision and AI.
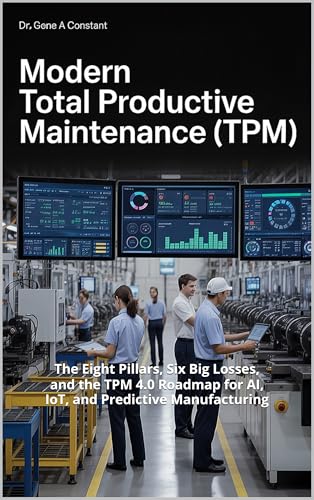
Modern Total Productive Maintenance (TPM) by Dr. Gene A Constant. This lesson comes from chapter thirteen. Read the whole book free in the reader, or keep a copy.
Buy a copy — it funds a free seat
GSU is a 501(c)(3) nonprofit and book sales are its only income. A purchase is not a tax-deductible donation. This lesson is free and always will be.