Lesson 9 of 20 · Chapter 9
The Role of Data in Modern TPM
By now the plant knows what normal looks like and how to respond when it drifts. This chapter asks: how will we know, reliably and early, across every shift? The answer is data, but not “more data” as a hobby. It is data that people trust, tied to decision rules, and used to fix conditions instead of blaming people. Done badly, a dashboard is just an expensive way to distract people with numbers nobody believes.
Choose how you want to learn
You can change this any time. Every level does the same hands-on steps. Press Listen on any part to hear it read aloud.
- 1 · Logs to dashboards
- 2 · Data you can trust
- 3 · Condition tracking
- 4 · Decision rules
- 5 · Irritating or expensive
- 6 · Try it at work
- 7 · Your card
- 8 · Check yourself
Part 1
From a clipboard to a control panel
Most plants start with a manual log: a clipboard, a whiteboard, a spreadsheet filled in when someone has time. The problem is that the operator must choose between writing and running.
So the log gets filled in later, from memory. Five small stops become “a bunch of stops.” A fault that keeps coming back becomes “random.”
A good dashboard makes recording easy at the moment it happens: one tap to choose a stop reason from a short, clear list. Then it shows patterns and triggers action.
Manual logs also sit outside the pipeline that turns observation into action, and if categories are not consistent, the plant cannot compare days, shifts, assets or countermeasures. Over time the log becomes a storybook rather than a control system.
A dashboard connected to work management can do what a log cannot: make recurrence visible, send a pattern to focused improvement or a planned fix by rule, and show whether a countermeasure really made the loss drop and stay down across shifts. That is the shift from recording to controlling.
“The log is updated later from memory, and memory rounds the truth into convenience.”
“Five minor stops become “a bunch of stops.” A recurring fault becomes “random.” A slow drift in speed becomes invisible because no one wrote down each moment of hesitation.”
“This is where the shift from logs to dashboards becomes a shift from recording to controlling.”
Read the whole chapter free in the book reader.
One shift on the bagger (an illustration). See what survives when it is written up from memory, and what survives when it is tapped in at the moment.
Part 2
Data that deserves trust
A number is only useful if people believe it. OEE can be worked out to three decimal places while the stop reasons behind it are wrong.
Stop reasons must be short, clear and specific. “Photo-eye blocked” points to cleaning. “Photo-eye signal unstable” points to a loose bracket, wiring or vibration. Mixing them up sends the fix to the wrong place.
And never use the data to blame people. If people think the dashboard is for finding who had the most downtime, they will quietly shape the data to protect themselves.
If the dashboard disagrees with reality, do not force people to accept the dashboard; fix the measurement. Otherwise people build shadow logs and the plant returns to several versions of the truth.
If people pick the “closest option” just to move on, that is not a people problem but a design problem: too many categories, unclear definitions, or a step that adds friction at the moment of truth. People protect systems that protect them.
“OEE can be calculated to three decimal places while the stop reasons are wrong, the sensors misclassify states, or operators select the closest option just to move on.”
“If people believe data will be used to blame, they will protect themselves by shaping the data.”
“The correct managerial question is the one we have used since Chapter 6: “What condition created this loss, and what in the system allowed that condition to persist?” People protect systems that protect them.”
Three moments that decide whether people trust the data. Choose what TPM would do.
Part 3
Watch the signs that come before failure
Every important machine has a few health signs that change before it fails: temperature, vibration, pressure, even how often someone presses the reset button.
Track them against a normal band. When a gearbox is getting a little hotter each week, you can see it, even though the machine still runs.
Then you can plan the fix calmly, instead of fighting a breakdown in the middle of a shift.
The plant’s first design choice is not which technology to buy, but which conditions to control. Monitoring should be anchored to known pain points, where signal has immediate value and adoption happens fastest; people trust it when it helps them win today’s fight without new bureaucracy.
Monitoring supports the operator’s eyes rather than replacing them. It also shows quickly whether a countermeasure worked: a lubrication change either moves the temperature trend or it does not.
“Condition tracking starts with a simple concept: every critical asset has a small set of health indicators that change before failure, before defects, and before unsafe improvisation becomes tempting.”
“The plant’s first design choice is therefore not which technology to buy, but which conditions to control.”
“If a gearbox temperature trend is rising week over week, it is visible even if the machine still runs.”
Twelve weeks of gearbox temperature. Move through the weeks and watch which rule applies. The readings are an illustration.
Part 4
Every signal needs a rule, or it becomes noise
If every small change sets off an alarm, people learn to switch the alarms off. That is called alarm fatigue.
So each signal gets a decision rule, like the ones you learned for safety and quality: some mean stop now, some mean call maintenance quickly, some mean tag it and plan the fix.
Data makes stopping less political. If the reading is outside the band, the decision is not personal. It is the rule.
The plant chooses a small number of control points per asset, links them to likely failure modes and quality-critical conditions, and defines what happens when they drift. The chapter’s compressed-air example: sustained low header pressure triggers immediate escalation; compressor running outside production hours triggers an energy abnormality tag.
Condition signals also enter the same work pipeline as defect tags, with clear triage and a verification that proves the condition is restored. If a plant cannot close defect tags reliably, adding more signals only creates more frustration.
“If every deviation triggers an alert, people will learn to silence the system.”
“The TPM approach is to build decision rules the same way we built stop authority for safety and quality.”
“Data makes stop decisions less political by making normal measurable.”
Five signals from the monitoring system. Choose the rule for each one.
Part 5
Solve what is expensive, not what is irritating
A dramatic breakdown gets everyone’s attention. A two-minute stop that happens fifty times a day does not. But which one costs more?
Data answers that: minutes each × how often. Often the quiet, frequent stop is the expensive one.
Then every decision follows the loop you know: restore it, stabilise the method so it stays fixed, and improve the design so the cause is gone. And check that the loss really dropped and stayed down across shifts.
A recurring stop cleared one event at a time is a chronic condition treated as a string of one-off repairs: the chapter calls it normalised abnormality wearing the uniform of busyness. It belongs in a design countermeasure, a shield, a purge, a bracket redesign or a method change.
Countermeasures are hypotheses that must be verified. If an air purge is added to stop sensor contamination, the micro-stop frequency should drop and stay down across shifts; if it does not, the team revisits the condition logic. The bench below puts two stops side by side.
“That is normalized abnormality wearing the uniform of busyness.”
“Data-driven decision making treats countermeasures as hypotheses that must be verified.”
“In other words, data helps the plant stop solving what is irritating and start solving what is expensive.”
The Weekly Loss Bench. Set two stops, choose which to attack, and decide how the data is used.
Part 6
Try it where you work
Do these on a real machine: at work if you work with equipment, or at home on a car, washing machine, furnace or lawn mower if you do not. Tick each one when it is done. Safety first: look and clean only what you are allowed to touch, never reach into moving equipment, and follow your site’s lockout rules.
Part 7
Your “My Health Signal” card
Set up one health signal for one machine you care about. Nothing you type here leaves this device.
My Health Signal
Global Sovereign University · Modern TPM, lesson 9
Data that works
- Record it at the moment, from a short clear list.
- Fix the measurement when it disagrees with reality.
- Give every signal a rule.
- Use it to fix conditions, never to blame.
- Check the loss dropped and stayed down.
Memory rounds the truth into convenience. Solve what is expensive, not what is irritating.
Part 8
Check yourself
Six real situations. Pick what you would do. You will see why after each one.
Lesson 9 complete.
You can now tell a log from a control system, keep data trustworthy, set a health signal with a normal band and decision rules, and use weekly minutes to pick what to fix first. Next: Lesson 10, intelligent TPM: IoT, sensors and predictive maintenance.
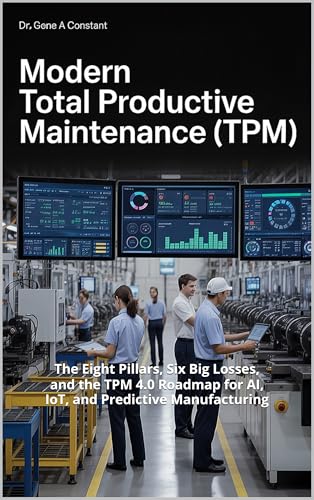
Modern Total Productive Maintenance (TPM) by Dr. Gene A Constant. This lesson comes from chapter nine. Read the whole book free in the reader, or keep a copy.
Buy a copy — it funds a free seat
GSU is a 501(c)(3) nonprofit and book sales are its only income. A purchase is not a tax-deductible donation. This lesson is free and always will be.